


One of things I wanted to accomplish when I began learning more about electronics was to build a small device from the ground up. This would include sourcing all parts, writing the necessary code, and designing and 3D printing an enclosure for the device. Given the state the world at this time, as my first foray into electronics design, I decided to make a little device to keep track of US COVID-19 stats.
Bill of Materials
- 1 × Wemos LOLIN D32
- 1 × MSP2402 SPI LCD Screen
- 1 × Protoboard
- 3 × JST connectors
- 2 × Pin headers
Starting off small, I used a micro-controller that came with everything and the kitchen sink. The Wemos LOLIN D32 is a fantastic little piece of electronics that cost around $5. It's a dev board based around the ESP32-WROOM-32 module and is compatible with the Arduino platform. and comes with WiFi and Bluetooth out of the box. Perhaps a little overkill for what I'm building, but it allowed me to get up and running very quickly.
The MSP2402 screen is an 2.4 inch TFT LCD Screen with a resolution of 320x240 pixels. I chose a larger screen so that I can could make something large enough for "at-a-glance" stats that I could put on a shelf somewhere.
All major pieces were connected together on a protoboard using JST connectors and pin headers so that future revisions can reuse the same components.
Writing the Code
The code for the project is available on GitHub.
The project utilizes a couple useful utilities to make development a lot easier. First and foremost is the PlatformIO IDE plugin for VS Code. This brings some modern niceties that aren't available with the standard Arduino IDE such as dependency version management, a command line based build system, and the ability to use the code editor of your choice.
For the implementation itself, I used:
- Arduino HTTPClient library to make requests to the COVID-19 stats API
- ArduinoJson to parse the API results
- TFT_eSPI to display the results
The basic loop function would look like something below:
1 bool updateScreen = false;
2
3 void loop() {
4 if (wifi.run() == WL_CONNECTED) {
5 unsigned long currentTime = millis();
6 if (currentTime - LAST_UPDATED_TIME >= UPDATE_TIME_MS) {
7 LAST_UPDATED_TIME = currentTime;
8 update_tracker()
9 }
10 }
11
12 if (updateScreen) {
13 render_stats();
14 }
15 }
We want to make sure we have an internet connection (wifi.run()) and if everything
looks good, we can go ahead and make a request to the API. If anything has changed
in the stats, we'll set a flag to update the screen. Once that request is done,
if the screen update flag is set, we can run through the code to re-render the
contents of the screen.
All in all, the code was very straightforward and pretty similar to how you would build a similar stats tracker in any other language/platform.
Wiring Schematic
Now for the hardware.
To keep track of all the different wires, I used kicad to build out a schematic based on the breadboard prototype I had built. As I get better at kicad, my hope is eventually turn some of these schematics into actual PCBs that can be printed, but for the time being, it's a handy way to visualize the connections.
![]()
For this first build, I left out the button which allows you to jump to different screens, but the code and schematic still handles this.
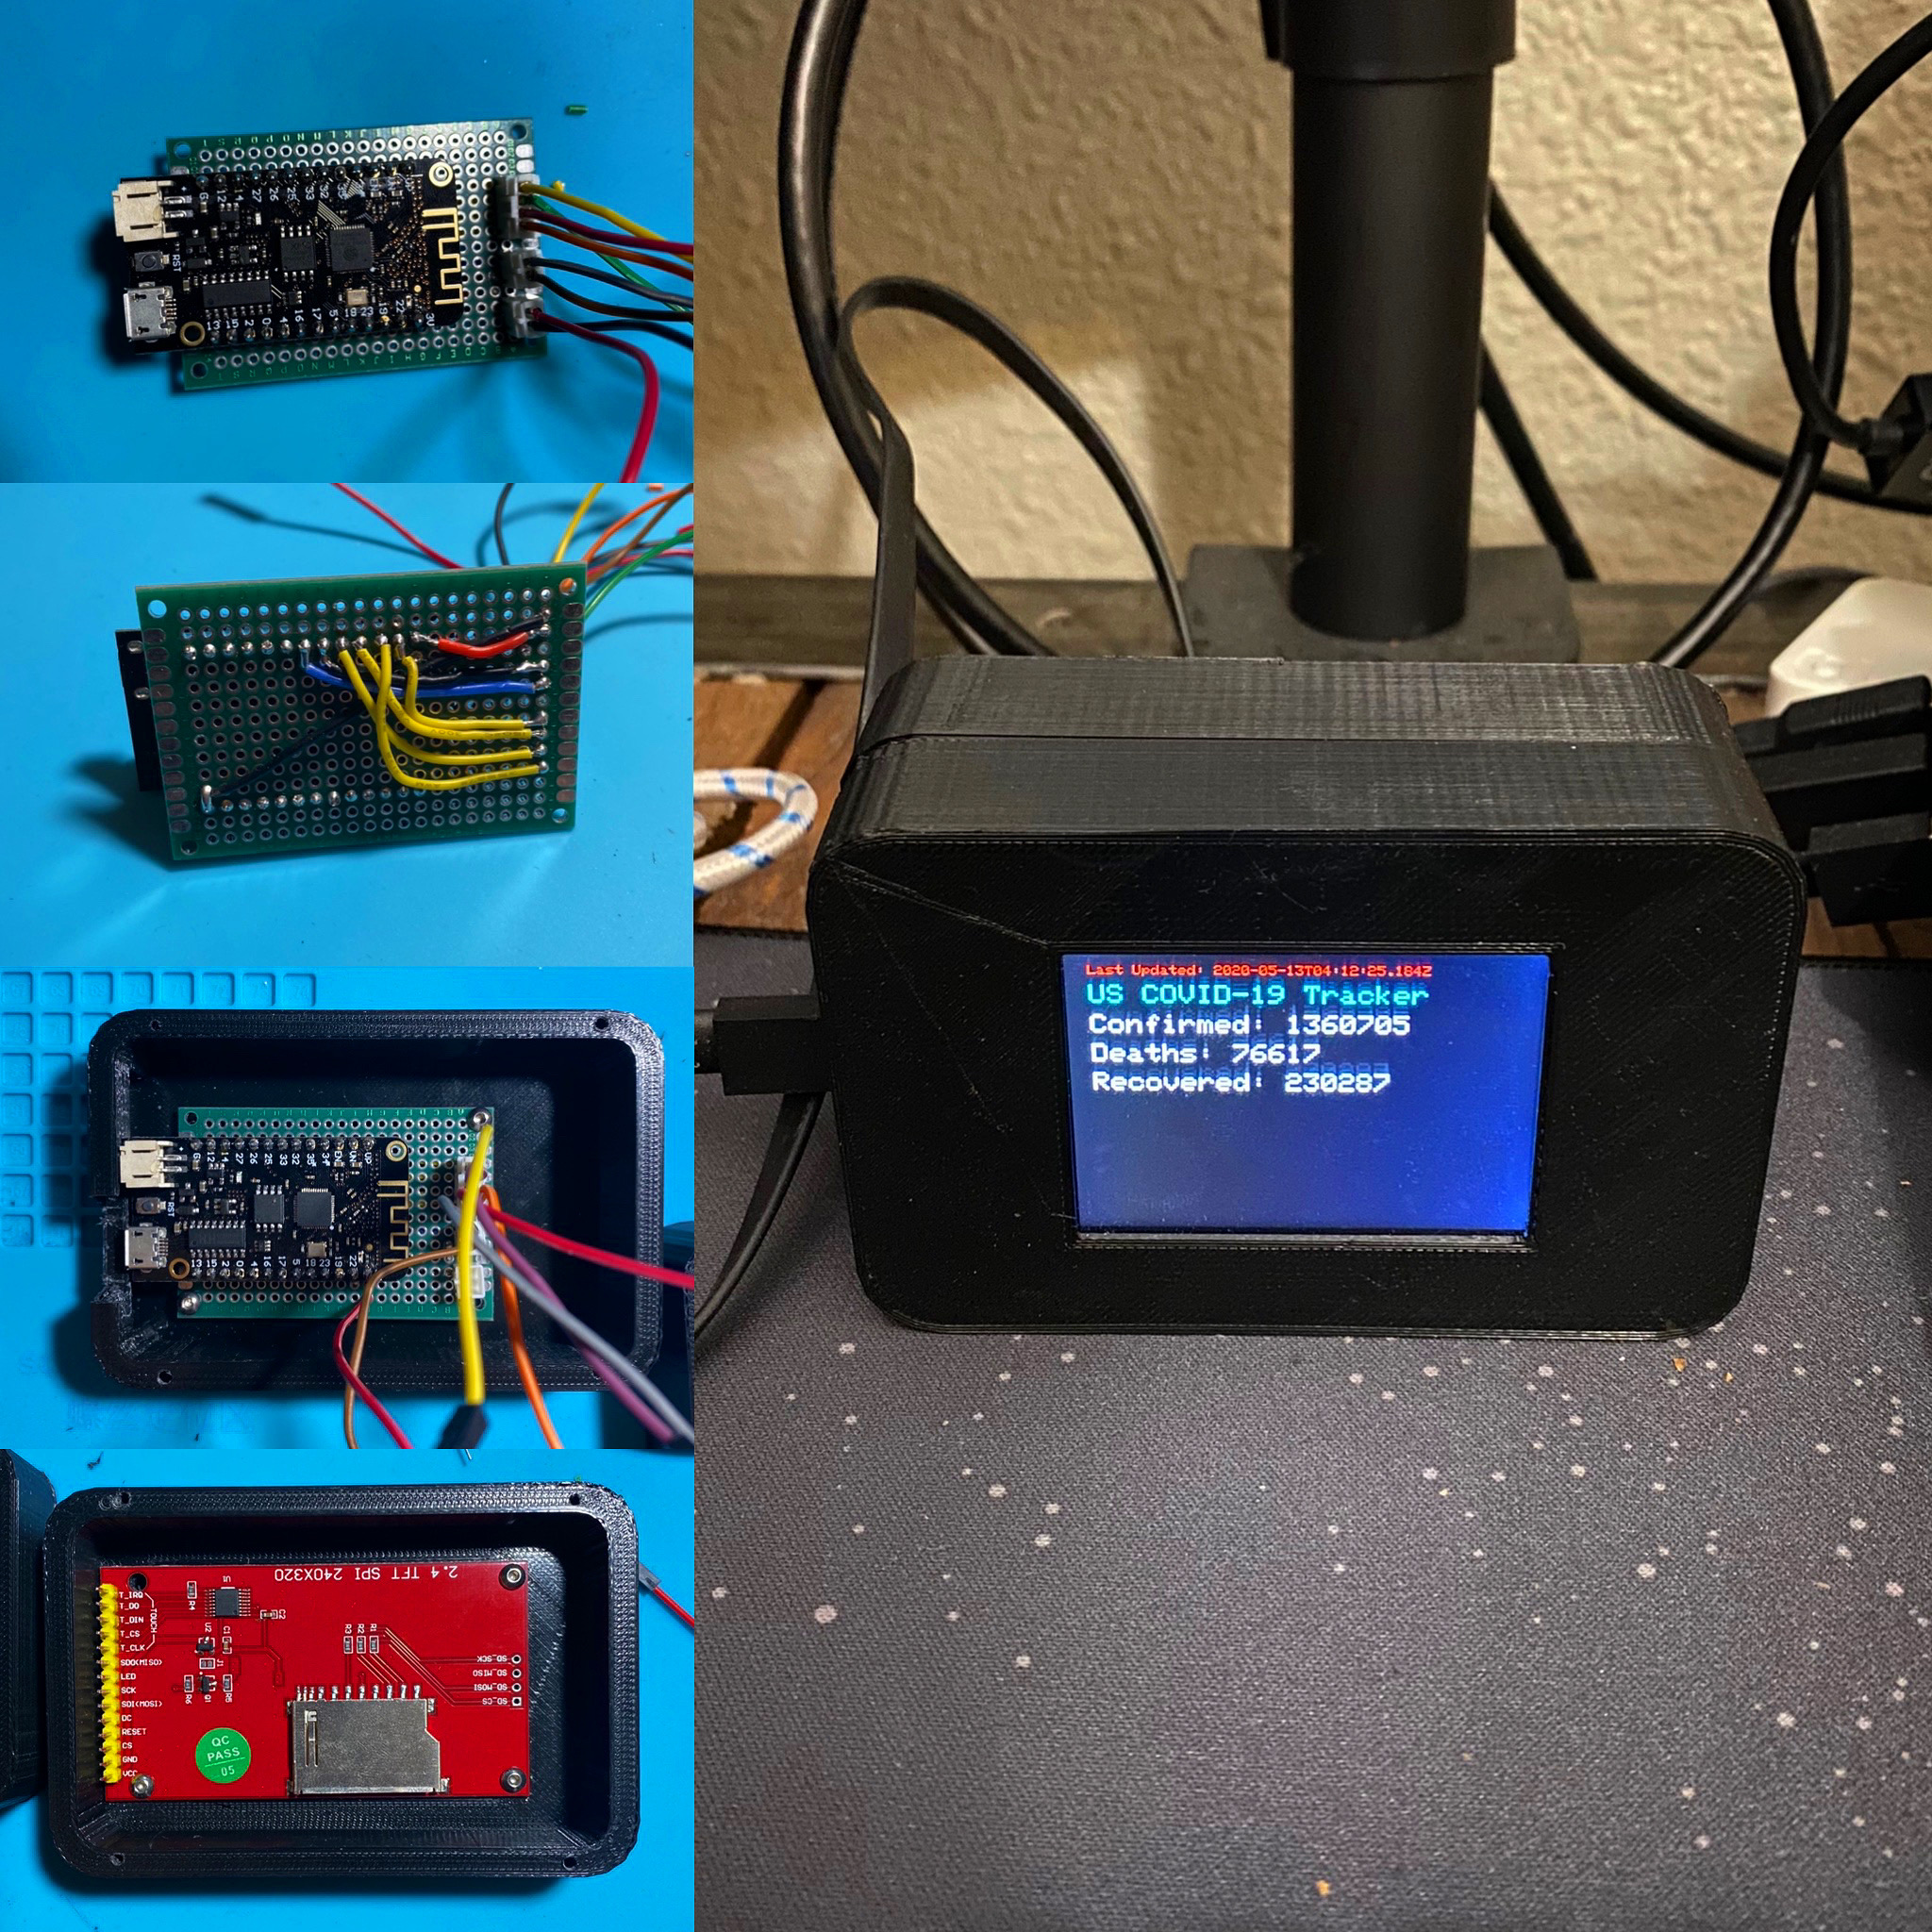
Below are some photos of the final soldered result:
- Photo #1: Overview of the entire project.
- Photo #2: Closeup of the soldering for the main board.
- Photo #3: Closeup of the LCD setup.
Designing & Printing an Enclosure
For the enclosure design, I settled on using Shapr3D for the iPad. It is a fantastic application that has everything I need as a hobbyist to get things done. Since the enclosure is nothing more than a simple rectangular box, diving into more complex tools like Fusion 360 or AutoCAD just didn't seem like a lot of fun.
This was my first enclosure that was designed from scratch, and is comprised of two large halves that are screwed together. The files are available here for download.
I used my MonoPrice Maker Select v2 to print out the enclosure and test prototypes before finally putting everything together.
Finished Result!
Here's a video fo the COVID tracker booting up and loading the data
Some things I would like to work on for v2 of this enclosure:
- New enclosure with better assembly and holes for buttons. The two halves was a naive design decision due to inexperience and made assmebly more difficult than necessary.
- Adding additional screens that can be toggled via buttons.